Overview
Project Documentation

- Note: A more recent set of results are available. These results are provided for historical context.
Yahoo! Cloud Server Benchmark
The YCSB (Yahoo! Cloud Server Benchmark) provides a suite for testing various data stores against a set of well defined workloads that attempt to mimic different use cases. For our purposes we are using the framework to compare the performance of the legacy MongoDB Java driver to the MongoDB Asynchronous Java Driver.
A client has been created to closely mimic the behavior of the legacy client provided with the YCSB benchmark. We have extended the benchmark client to only create a single logical connection to the database instead of a new logical connection for each thread in the test. This more accurately reflects real world use where the Mongo is created as a singleton in the application and then shared across multiple threads. We have also updated the client to accept a property representing the number of connections that can be used to access the MongoDB server. All changes have been added to a YCSB Pull Request
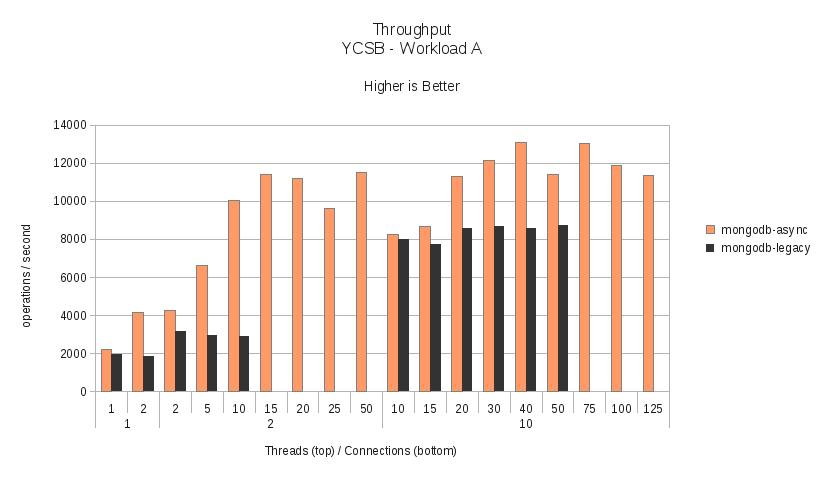
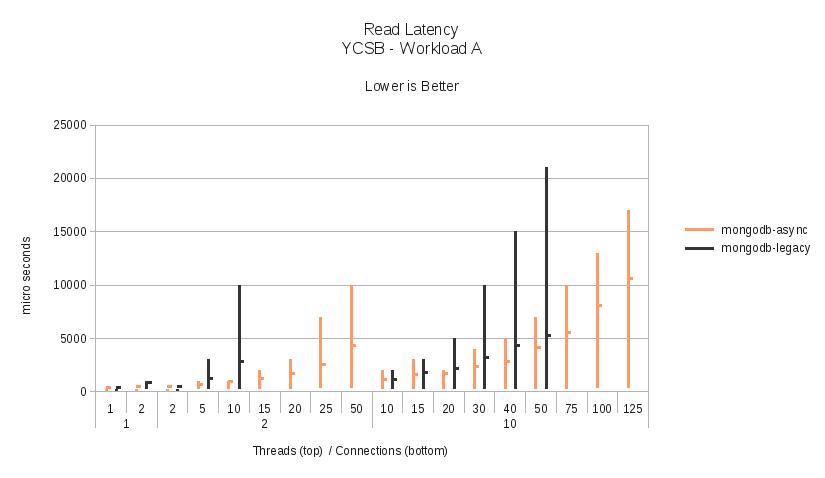
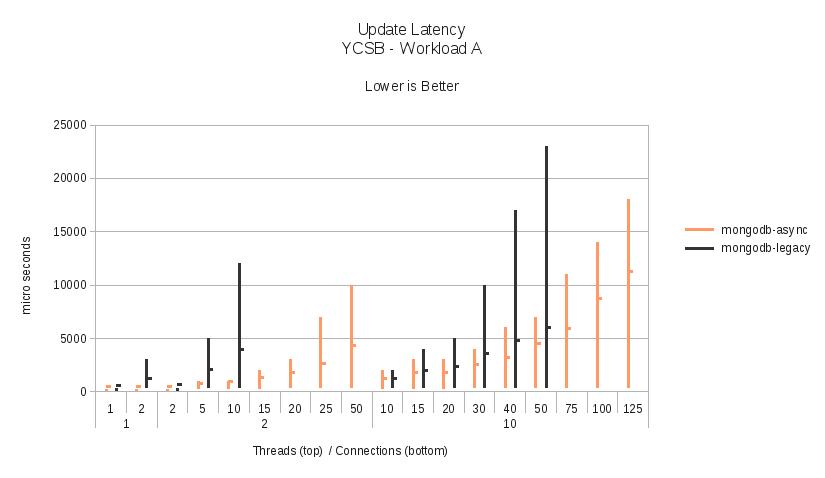
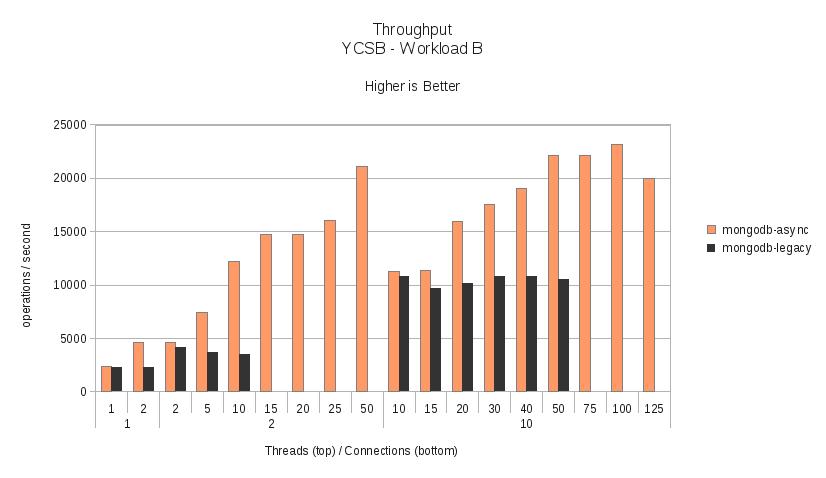
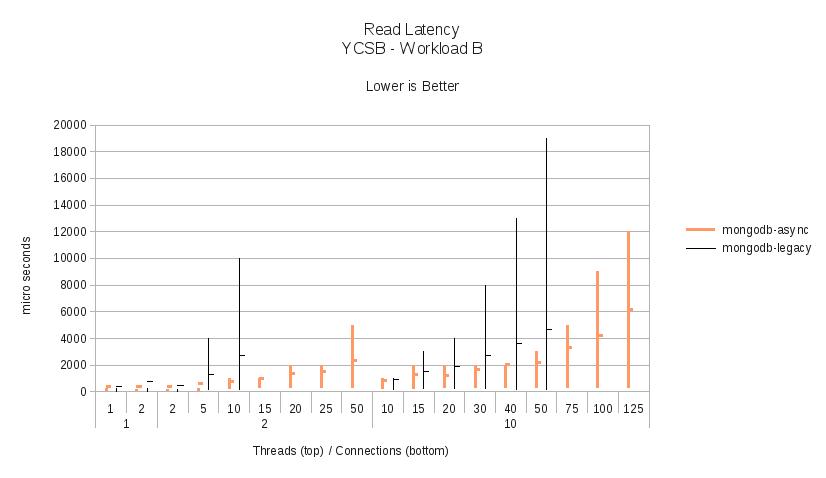
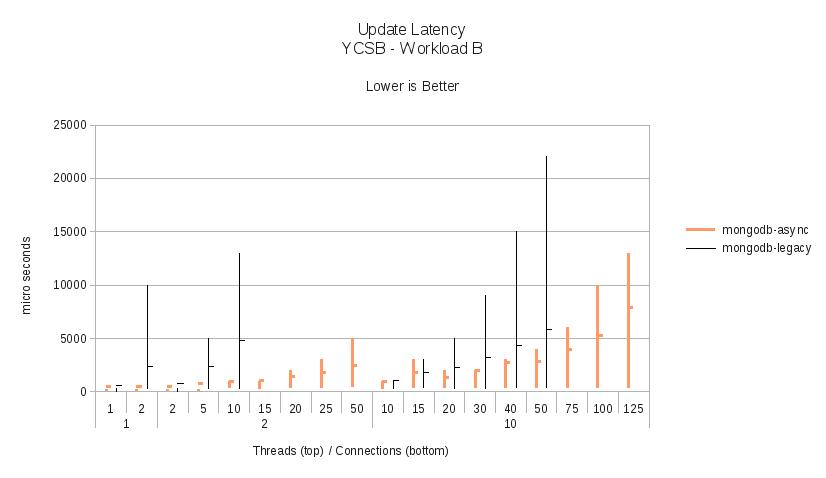
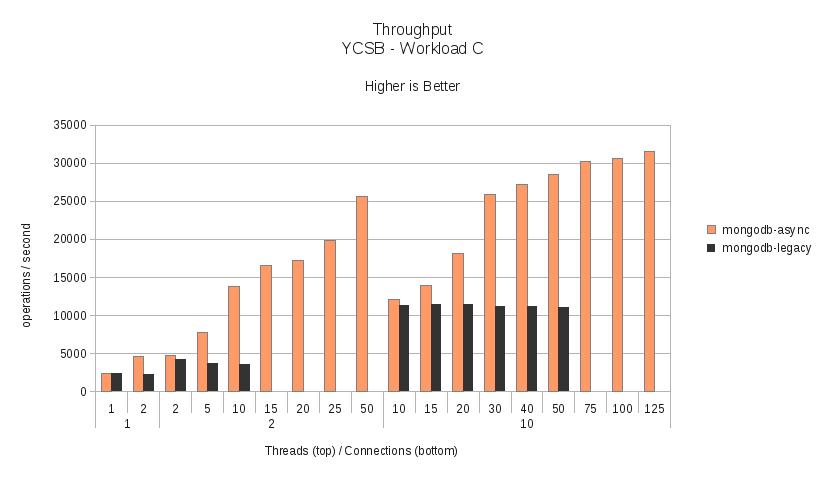
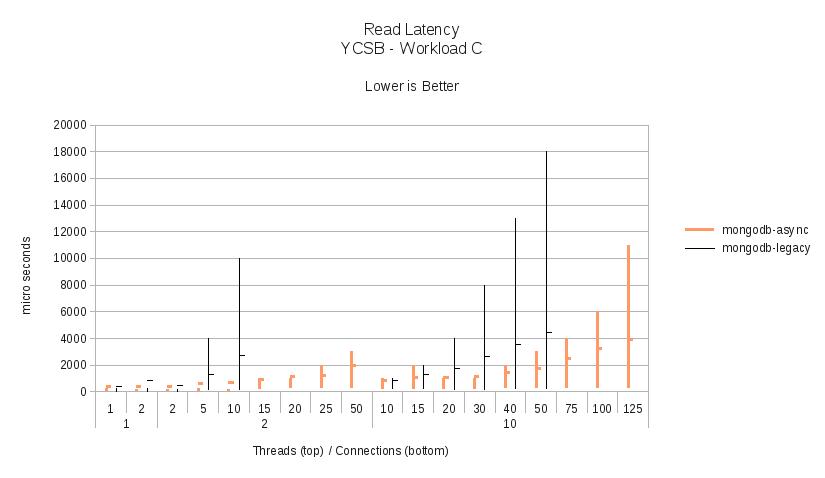
The results of the benchmark for the 6 provided workloads (A-F) show clearly that the MongoDB Asynchronous Java Driver has lower latency, lower variability in latency and higher throughput across the benchmark scenarios. In addition, this driver has a much lower slope of increasing latency as contention for the available connections increases.
The following sections contain a high level description of each workload and the results for each. The full launch script, output, and analysis spreadsheet are also available for review.
Note: The legacy driver did not successfully complete all of the test runs due to running out of semaphores for threads waiting for connections when the number of threads is greater than 5 times the number of connections. Those results have been removed from the analysis as invalid. The legacy driver does provide the ability to tune the number of allowed waiting connections. The trends in the latency and throughput for the legacy driver are still quite clear from the diagrams below. Future re-runs of this test may attempt to adjust the number of allowed waiting threads based on the number of test connections and threads.
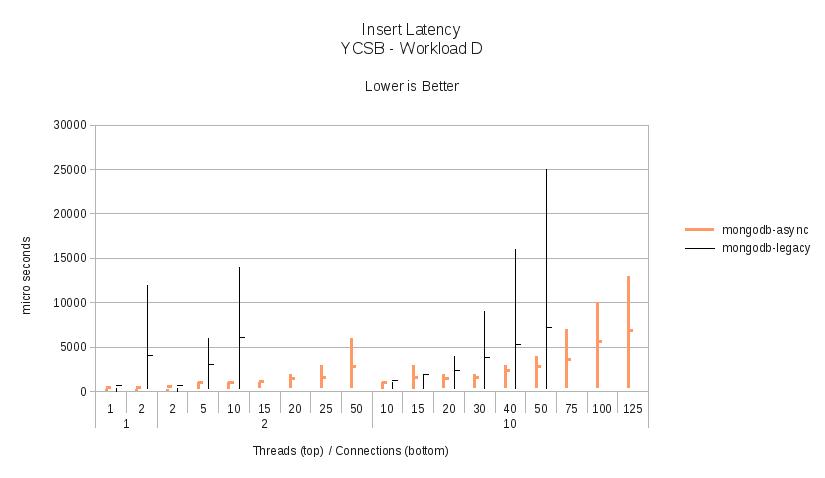
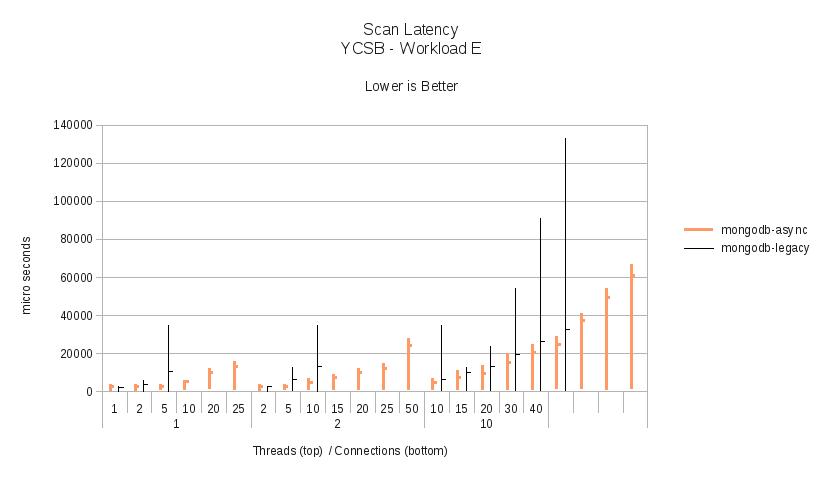
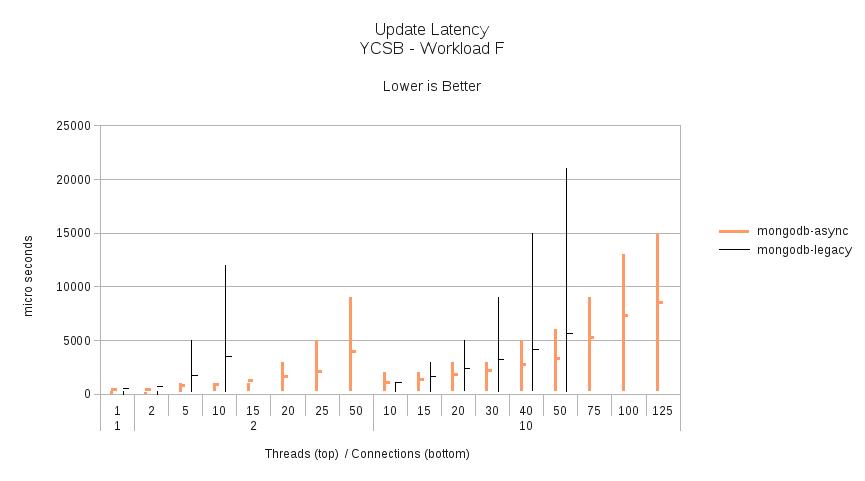
In a graphs below the latency values are displayed as a stock chart where the maximum value is the 95th percentile and the close value is the average latency. It is important to note that the resolution of the 95th percentile reported by the YCSB is in milliseconds. The minimum and average values are reported in microseconds. In the case of the 95th percentile being less than 1 millisecond a value of zero is reported, where for the minimum and average values non-zero values are reported.
Workload A - Update Heavy Workload
The first workload has a 50/50 split between reads and updates of individual records. This workload tries to model a session store for a web container.
All of the default settings for the workload are the same as those provided by the benchmark except the number of records and operations have been increased to 1,000,000 each.
Workload B - Read Mostly Workload
The second workload has a 95/5 split between reads and updates of individual records. This workload tries to model a blog or photo sharing entry where reads dominate but there may be occasional updates for comments or tags.
All of the default settings for the workload are the same as those provided by the benchmark except the number of records and operations have been increased to 1,000,000 each.
Workload C - Read Only Workload
The third workload only performs reads of records. This workload tries to model a situation of a read-only cache where updates are performed by some off-line process.
All of the default settings for the workload are the same as those provided by the benchmark except the number of records and operations have been increased to 1,000,000 each.
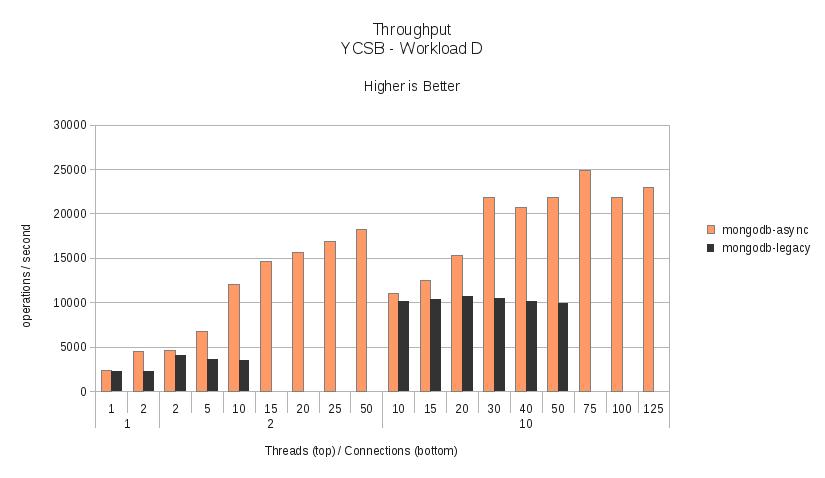
Workload D - Read Latest Workload
The fourth workload has a 95/5 split between reads and inserts of individual records. This workload tries to model a social network of user status updates.
All of the default settings for the workload are the same as those provided by the benchmark except the number of records and operations have been increased to 1,000,000 each.

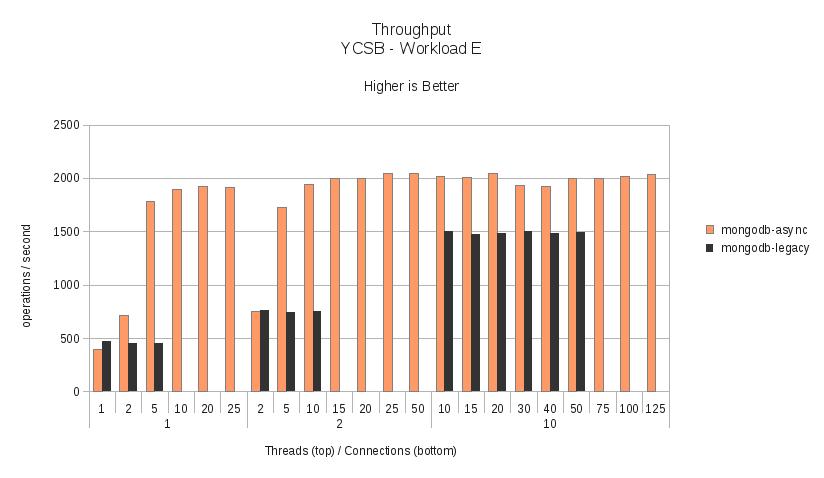
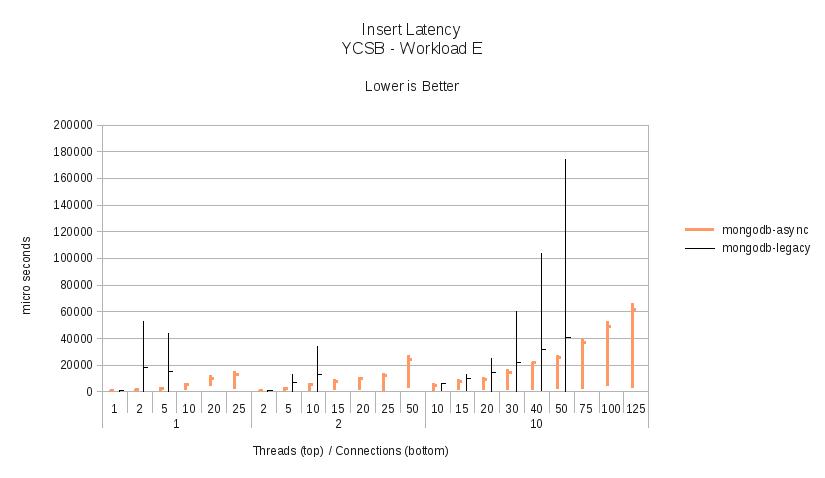
Workload E - Read Latest Workload
The fifth workload has a 95/5 split between scans and inserts of records. This workload tries to model a threaded discussion of clustered comments.
All of the default settings for the workload are the same as those provided by the benchmark except the number of records has been increased to 1,000,000 and the number of operations has been increased to 250,000.
This workload reads large volumes of data from the MongoDB servers. mongostat regularly reported in excess of 100MB/second netout during the Asynchronous Java Driver runs. The relatively flat throughput is primarily due to the limitations in bandwidth (1Gb/s) between the client machine and server.
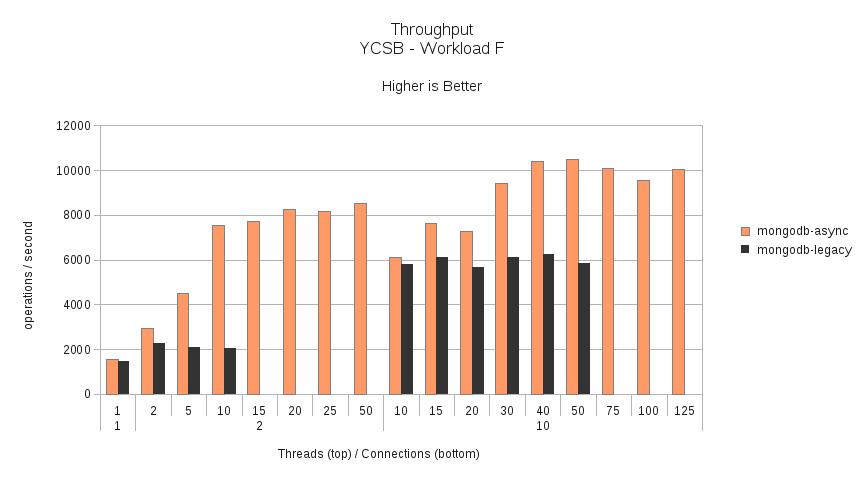
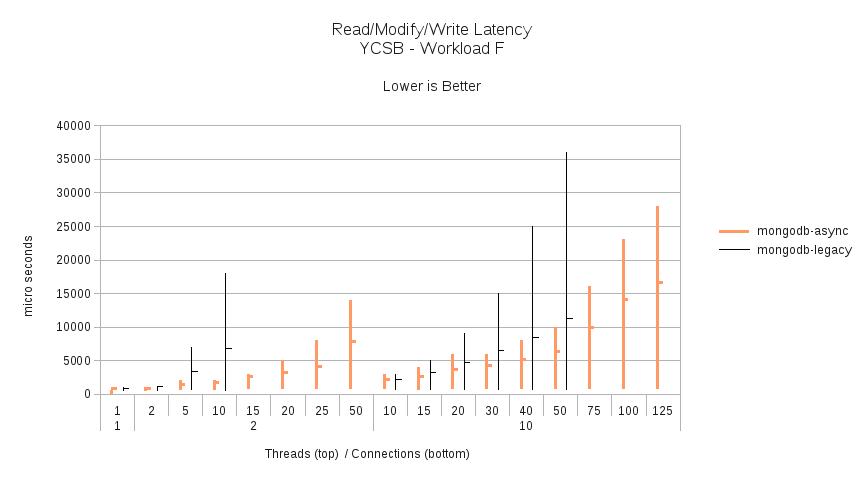
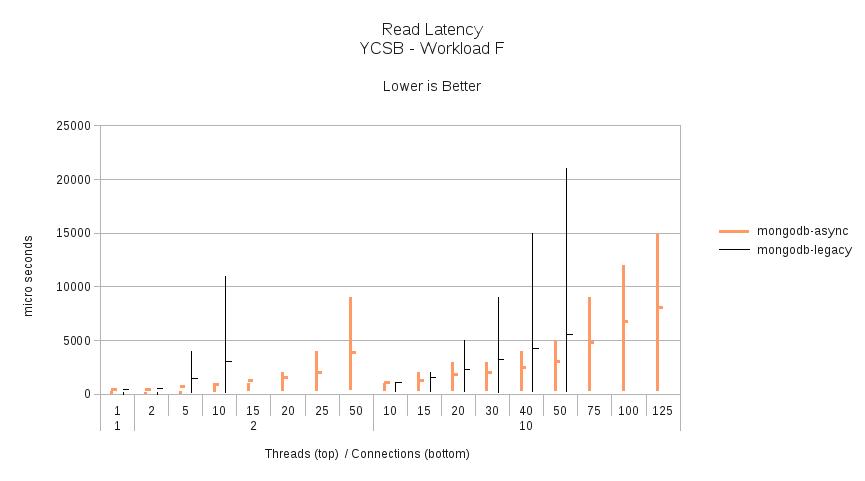
Workload F - Read-Modify-Write Workload
The last workload has a 50/50 split between reads and read/modify/updates of records.
All of the default settings for the workload are the same as those provided by the benchmark except the number of records and operations have been increased to 1,000,000 each.
Test Environment
The test client was run on a Dell XPS 15z laptop with a Intel(R) Core(TM) i5-2430M CPU @ 2.40GHz and 8GB of memory running Fedora 16. JDK 1.7.0_02 was used.
The MongoDB server was a standalone mongod running on a separate machine but both machines are connected to the same 1Gb/s switch. Average ping times between the machines is 0.25 ms. The mongod process was started using the following command line:
mongodb-linux-x86_64-2.2.0/bin/mongod --port 27017 --fork --dbpath /tmp/mongod/ --logpath /tmp/mongod/mongod.log --nojournal
The server has a Intel(R) Pentium (R) D CPU 3.00GHz with 8GB of memory running Fedora 16.